OBJECTIVE
The objective of this project was to develop a model that, for a specific observation of current indicators of the Dow Jones Industrial Average (DJIA) index:
- Predicts the next period’s return for DJIA via Linear Regression
- Recommends whether to Buy / Sell DJIA index via Logistic Regression
Principal Component Analysis was used for dimension reduction
Motivation: Utilize these models to inform investment decisions regarding the DJIA.
BACKGROUND AND DATA
Inputs and Outputs
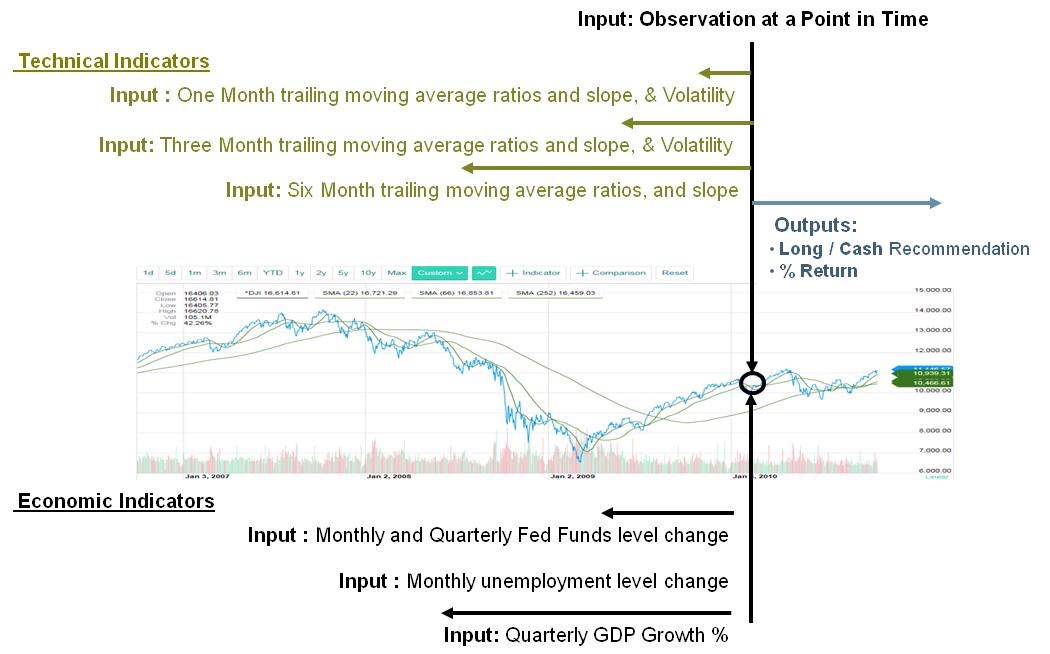
Both technical and macro-economic indicators were used as inputs to the model
Inputs – Technical indicators
- Exponential moving averages over different rolling periods. This helps smooth the signal as well as capture the temporal nature of the point in time observation.
- Slopes of exponential moving averages. This helps also helps capture the temporal nature of the point in time observation.
- Ratios of these moving averages (i.e. is the 21 day EMA higher than the 126 day EMA). These are significance of these ratios is explained in the next section.
- Annualized Volatilities: Accounts for the dispersion of the rate of change – in times of stress volatility tends to increase.
Inputs – Macro indicators
- Fed Funds rate changes: Negative changes tend to indicate easing or a view that the Fed feels the economy is slowing down or in recession.
- Unemployment level changes
- QDP growth.
Outputs
- Expected forward returns calculated.
- Long (Buy) / Cash (Sell) indicator
Technical Indicators – Background
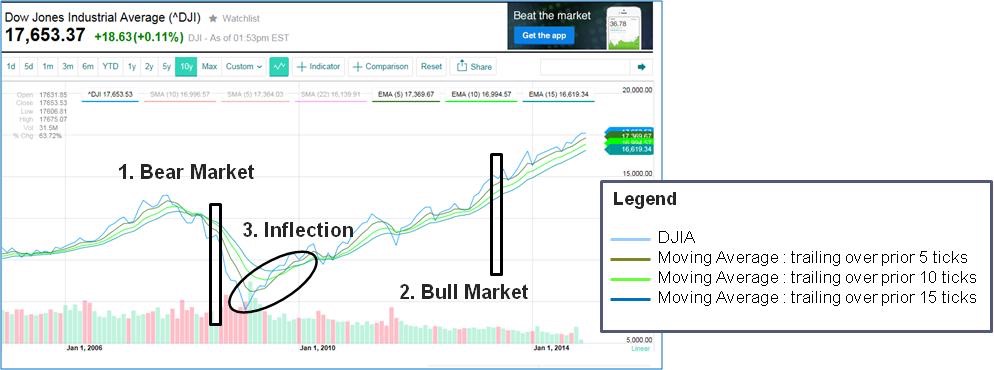
Below are the conditions found in different types of markets
Bear Market
- Long-term moving averages higher than short-term moving averages
- Moving averages higher than index
- Negative slopes
Bull Market
- Long term moving averages lower than short-term moving averages
- Positive slopes
- Moving averages lower than index
Inflection
- Order of moving averages reverses
- Sign of slopes reverse
Based on this the following technical indicators were used
- Ratio of 6 month EMA to DJIA Index: EMA126_I
- Ratio of 3 month EMA to 6 month EMA: EMA63_R
- Ratio of 1 month EMA to 3 month EMA: EMA21_R
- Slope of 6 month EMA as a ratio to DJIA index
- Slope of 3 month EMA as a ratio to DJIA index
Sourcing and Training and Validation Data
Data was sourced from:
- DJIA levels: finance.yahoo.com
- Slopes and Ratios: Calculated
- Volatilities: Calculated
- Macro Economic Data: government sites including Fed
Daily observations were collected, technical indicators calculated, and macro economic data overlayed. Then weekly observations were extracted:
- 3037 weekly observations from 1954 through 2013
- 2986 post removal of outliers
- Training Data – Selected a random 75% of observations
- Validation Data – Utilized remaining 25% of observations
Data Preparation
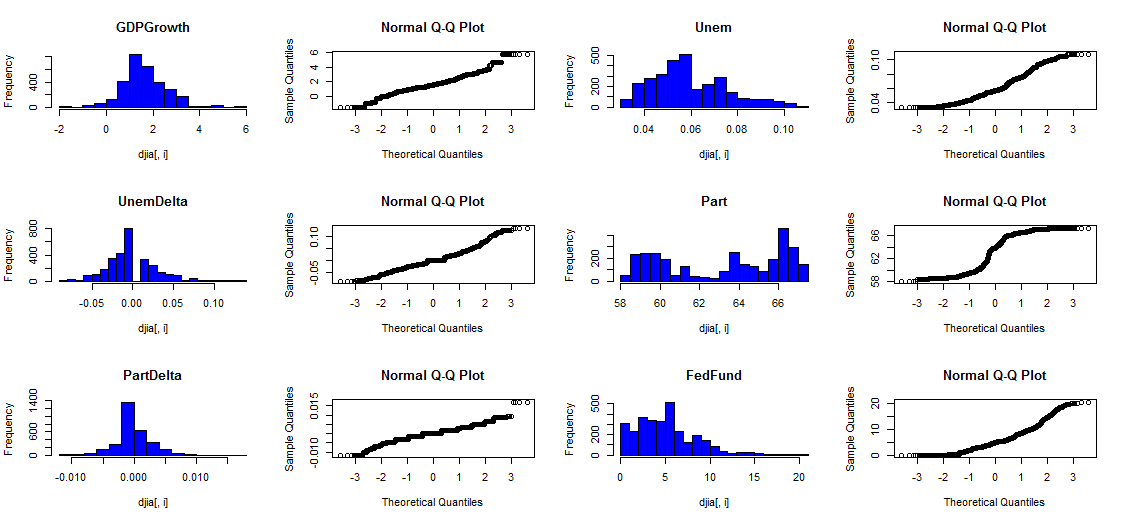
- The distributions of each input and continuous output variable were analyzed
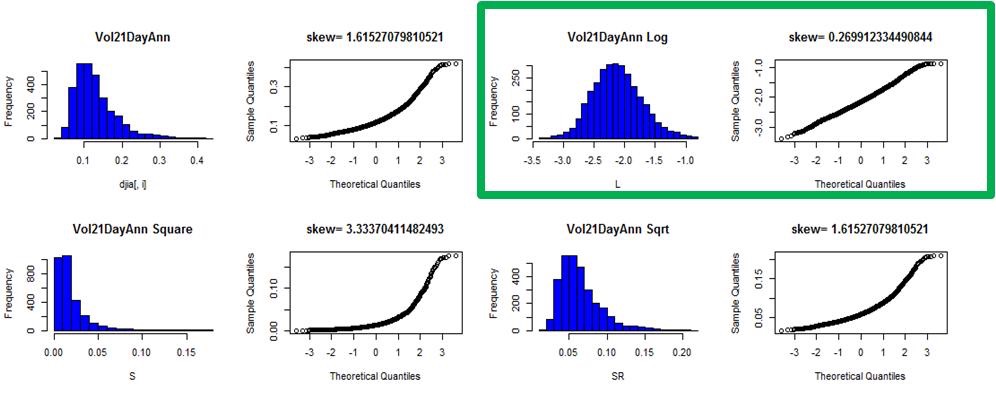
- Different transformations were attempted, where required, to achieve normality
- The data was then standardized and centered data by shifting assigning Z score.
- Below the 21 day volatility transformation example is illustrated …
Data Fields
Inputs (15 variables) and Target (3)
Data Summary Post Centering and Normalizing
The table below shows the correlation matrix of the normalized, centered, continuous variables
- As expected there is a high |absolute| correlation among the different moving averages, slopes and ratios
- Similarly there is a correlation between the 21 and 63 day volatilities
- Lastly the 1 month and 1 quarter change in Fed Funds rate also shows a level of correlation.
One of the key decisions was which time frames to include or exclude – instead of making that decision a-priori I used PCA to reduce dimensionality and remove multi co linearity.
PRINCIPAL COMPONENT ANALYSIS
PCA was applied to the input variables for the reasons listed in the prior section.
The first 4 PC’s were selected because
- Their Eigenvalues > or close to 1
- Their Cumulative variance accounted for 83% of the total.
This reduced the problem from a 15 variable model to four.
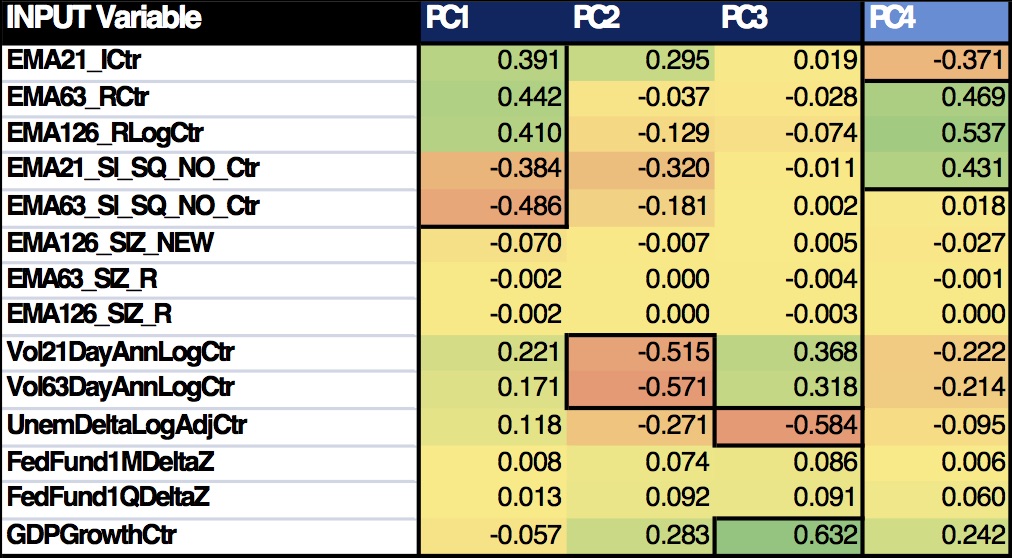
Then the rotation eigenvectors were used to interpret the meaning of the PC’s:
Based on the above, the following interpretations can be made:
LINEAR REGRESSION
Linear regression was applied to try to try to predict the forward monthly return of an observation:
- FwdReturn: a linear function of (PC1,PC2,PC3,PC4)
- In R the formula pattern is: train$FwdMReturnCtr ~ train$PC1 + train $PC2+ train$PC3+ train$PC4
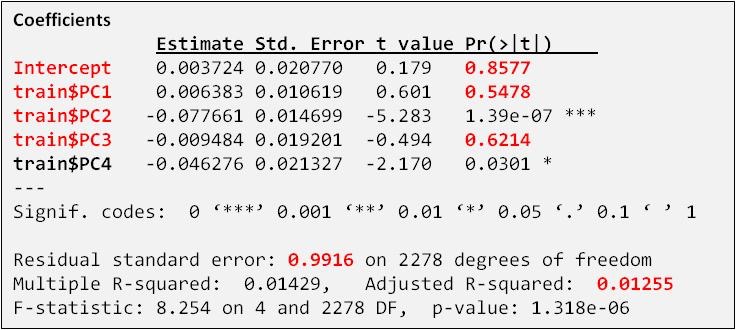
The coefficients and best fit description was as follows:
Observations & Conclusions
- Pr(>t) values lead us to Accept the Null Hypothesis that Intercept and Coefficiens in Red = 0. In other words this intercept and coefficients cannot be used.
- Adjusted R Squared is exceedingly low at 0.0125
Similar results were seen when the actual centered and normalized 15 Varibles were used.
This leads to the following conclusions –
- The behavior of forward returns as a function of the inputs cannot be modeled Linearly over this extensive time period (1954 to 2013).
- It is possible a better fit may be obtained for specific, shorter time periods, e.g. for specific types of Cyclical markets. I actually observed this in a prior class where a Decision Tree or Neural Network derived from the training data was more accurate for short Cyclical periods as compared to application to the entire timeline. This was not attempted here, though I still suspect the relationship is not likely to be linear.
LOGISTICS REGRESSION
A logistic regression was applied as follows –
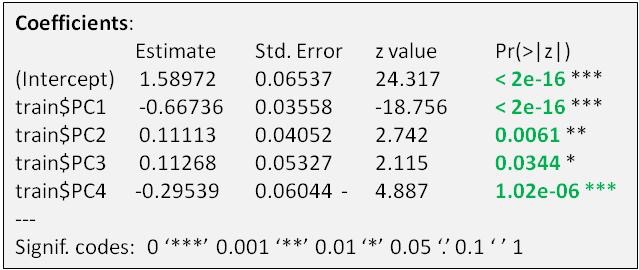
- log(odds(LongPosition))= a linear function of (PC1,PC2,PC3,PC4)
- In R: mylogit2 <- glm2(train$CycLC ~ train$PC1 + train $PC2+ train$PC3+ train$PC4, family=”binomial”)
Observations on Logistic Model
- Pr(>t) values lead us to Reject the Null Hypothesis that Intercept and Coefficiens in Green = 0. In other words we have a 96% + confidence level in these intercept and coefficients.
- So why did linear regression fail whereas logistics regression (at least at this point) appeared to do better? My interpretation is that when the ‘crowd’ makes decisions to enter or exit the market, they are ‘taking a bet’, based on a conscious or unconscious view on the Odds of that Bet. That odds decision appears to fit a linear model (i.e. a Linear Logistics Regression).
Validation of Model
The model was applied to the Validation data to assess accuracy of results …
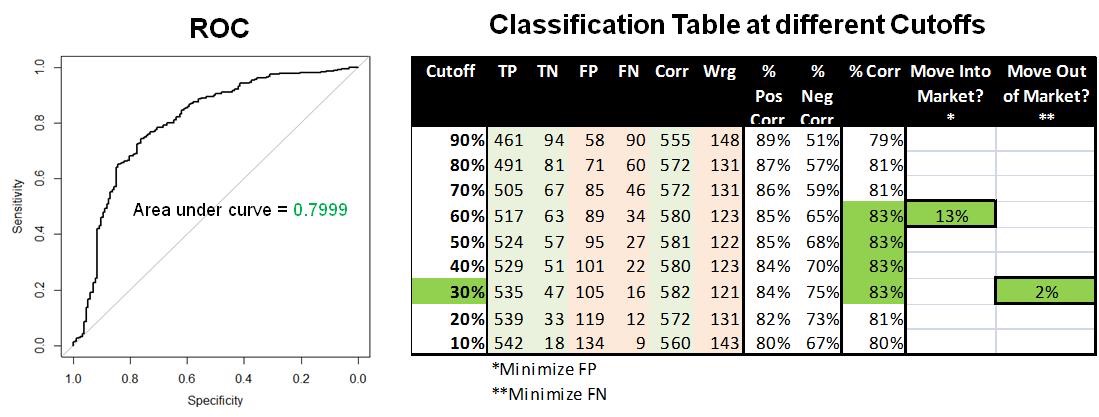
The area under the ROC curve is of 0.7999 which would indicate reasonably good predictions.
The maximum % Correct predictions are at a cutoff between 30% to 60% probability.
For a Move into Market signal (i.e. move from Cash to Long), you want to minimize false positives which yields a cutoff at 30%.
- At this level, we see 89 out of 703 observations are False Positives = 13%.
- Another measure is proportion of False Positives / Actual Positives) = 89/(517+34) = 16%.
- This compares to a total actual positives of 79%.
- Hence the logit model is definite improvement over a ‘random draw’ from the sample distribution.
For a Move out of Market signal you want to minimize false negatives, with yields a cutoff at 60%
- At this level, we see 16 out of 703 observations are False Negatives = 2%.
- Another measure is proportion of False Negatives / Actual Negatives =16/(63+89) = 11%.
- This compares to a total actual negatives of 21%.
- Hence the logit model is a good improvement over a ‘random draw’
CONCLUSIONS
- PCA yielded significant dimension reduction and intuitive principal components
- Linear regression unable to yield a good model – interactions among variables not linear at least for the length of period explored.
- Logistic regression resulted in a reasonable level of accuracy
NEXT STEPS
While the Logistics Model shows promise, the ultimate test is to back test it, simulating Buys and Sells over a historical period of time, and comparing the resulting returns to the actual DJIA return (i.e. Hold) as well as to actively managed leading broad index mutual funds under different market conditions.
============
APPENDIX
Sample R snipets
Outliers Removal
myOutlierIndexEMA21_Sl <- which(djia$EMA21_SlZ_NEW<(-3) | djia$EMA21_SlZ_NEW>(3))

myOutlierIndexEMA63_Sl <- which(djia$EMA63_SlZ_NEW<(-3) | djia$EMA63_SlZ_NEW>(3))

myOutlierIndex<-union(myOutlierIndexEMA21_Sl, myOutlierIndexEMA63_Sl)

myOutlierIndexEMA126_Sl <- which(djia$EMA126_SlZ_NEW<(-3) | djia$EMA126_SlZ_NEW>(3))

myOutlierIndex<-union(myOutlierIndex, myOutlierIndexEMA126_Sl)

myOutlierIndexEMA126_Sl_R <- which(djia$EMA126_SlZ_R<(-3) | djia$EMA126_SlZ_R>(3))

myOutlierIndex<-union(myOutlierIndex, myOutlierIndexEMA126_Sl_R)

myOutlierIndexEMA63_Sl_R <- which(djia$EMA63_SlZ_R<(-3) | djia$EMA63_SlZ_R>(3))

myOutlierIndex<-union(myOutlierIndex, myOutlierIndexEMA63_Sl_R)

myOutlierIndexFFM<- which(djia$FedFund1MDeltaZ<(-4) | djia$FedFund1MDeltaZ>(4))

myOutlierIndex<-union(myOutlierIndex, myOutlierIndexFFM)

myOutlierIndexFFQ<- which(djia$FedFund1QDeltaZ<(-4) | djia$FedFund1QDeltaZ>(4))

myOutlierIndex<-union(myOutlierIndex, myOutlierIndexFFQ)

length(myOutlierIndex)

djia$Outlier<-0

djia$Outlier[myOutlierIndex]<-1
Transformations
Min=min(djia[,i])

if (Min<0){adj = -2*Min}else {adj = 0}

d = skewness(djia[,i])[1]

hist(djia[,i],breaks=20,main=colnames(djia)[i],col='blue')

qqnorm(djia[,i],main=paste("skew=",toString(d)))

L=log(djia[,i]+adj)

dL = skewness(L)[1]

hist(L,breaks=20,main=paste(colnames(djia)[i],"Log"),col='blue')

qqnorm(L,main=paste("skew=",toString(dL)))

S=(djia[,i]+adj)^2

dS = skewness(S)[1]

hist(S,breaks=20,main=paste(colnames(djia)[i],"Square"),col='blue')

qqnorm(S,main=paste("skew=",toString(dS)))

SR=(djia[,i]+adj)^1/2

dSR = skewness(SR)[1]

hist(SR,breaks=20,main=paste(colnames(djia)[i],"Sqrt"),col='blue')

qqnorm(SR,main=paste("skew=",toString(dSR)))
Centering
v<-djia$FwdMReturn

vC<-scale(v,center=TRUE)

djia$FwdMReturnCtr<-vC

uvC<-(djia$FwdMReturnCtr*sd(djia$FwdMReturn))+mean(djia$FwdMReturn)
PCA
pcaModel <- prcomp(djia[,c('EMA21_ICtr', 'EMA63_RCtr', 'EMA126_RLogCtr', 'EMA21_Sl_SQ_NO_Ctr', 'EMA63_Sl_SQ_NO_Ctr', 'EMA126_SlZ_NEW', 'EMA63_SlZ_R', 'EMA126_SlZ_R', 'Vol21DayAnnLogCtr', 'Vol63DayAnnLogCtr', 'UnemDeltaLogAdjCtr', 'FedFund1MDeltaZ', 'FedFund1QDeltaZ', 'GDPGrowthCtr')], center = FALSE, scale = FALSE)

print(pcaModel)

summary(pcaModel)

plot(pcaModel, type = "l")
Linear Regression
fit<-lm(train$FwdMReturnCtr ~ train$PC1 + train $PC2+ train$PC3+ train$PC4)

summary(fit)
Logistic Regression
train<-subset(djia,djia$TrainSet > 1)

mylogit2 <- glm2(train$CycLC ~ train$PC1 + train $PC2+ train$PC3+ train$PC4, family="binomial")

summary(mylogit2)

p<-predict(mylogit2, train, type="response")

train$LogitPred<-p

g <- roc(CycLC ~ LogitPred, data = train)

plot(g)

val<-subset(djia,djia$TrainSet == 1)

val$LogOddsCycleL = 1.58972 -0.66736*val$PC1 + 0.11113*val$PC2 + 0.11268*val$PC3 -0.29539*val$PC4

val$OddsCycleL = 10^val$LogOddsCycleL

val$ProbCycleL = (val$OddsCycleL / (1+val$OddsCycleL ))

g <- roc(CycLC ~ ProbCycleL, data = val)

plot(g)

if (val$CycLC[j] == 1 && val[j,115+i] == 1) {val[j,124+i]='TP'}

if (val$CycLC[j] == 0 && val[j,115+i] == 0) {val[j,124+i]='TN'}

if (val$CycLC[j] == 1 && val[j,115+i] == 0) {val[j,124+i]='FN'}

if (val$CycLC[j] == 0 && val[j,115+i] == 1) {val[j,124+i]='FP'}
