I used social network analytics concepts with my team to build a model which derives movie recommendations for users. It was inspired by the Netflix Challenge.
OBJECTIVE
The objective is to model a movie recommendation engine using social media analytics concepts such as centrality measures, community detection, weighted network connections, implied linkages and utilization of additional graph, nodes and edge data.
The model will
- Derive movie recommendations for a specific user,
- Derive ‘off the beaten path’ movies the user may enjoy if they wish to try something different and
- Identify ‘bellwethers’ with whom pilots and movies can be previewed.
THE DATA
Since the Netflix data is not readily available due to the privacy issues, I manufactured data using Python. In the data set manufactured …
- There were a total of 190 users, 197 movies and 7584 ratings by the users.
- The users were divided in 4 groups.
- In addition manufactured data was ‘seeded’ with specific characteristics, to confirm whether the model picks or detects these.
- Numpy.random was used to ensure representative viewership and ratings distributions.
THE MODEL
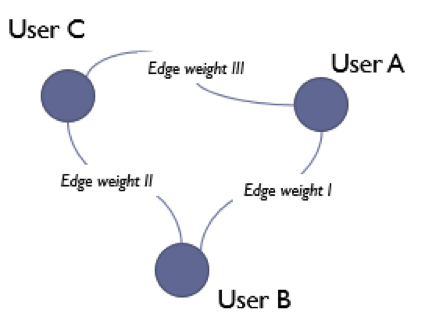
In the network model, nodes are users and the affinities (in terms of similarity of movie tastes) between them are represented as weighted, undirected edges.
Individual ratings range from 1 to 10. For simplicity, we have reduced the number of levels from 10 to 3 as follows:
- Like Movie (7 or above) = 2
- Lukewarm on Movie (5 to 7) = 1
- Did Not Like Movie (less than 5) = 0
For any pair of users which have rated the at least one common movie, the rating affinity for each movie was calculated by the formula Rating Affinity = 1 – |User 1 Rating – User 2 Rating|. This can be interpreted as
- 1: both users had the same rating (whether they liked the movie or not)
- – 1: users had opposite ratings
- 0: ratings were different but not opposite
To derive an edge weight, the Ratings Affinities for each pair of users were summed up get the total Movie Affinity. This resulted in 14,573 edges for the 190 nodes.
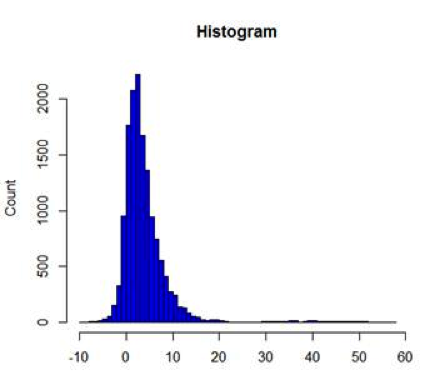
Once the affinities were calculated, a histogram distribution of them was plotted and only the 3rd quartile (Movie Affinity of 6 or above) was chosen to keep the high affinities. This reduced the number of edges to 5279
VISUALIZATION
The visualization was created using the software Gephi.
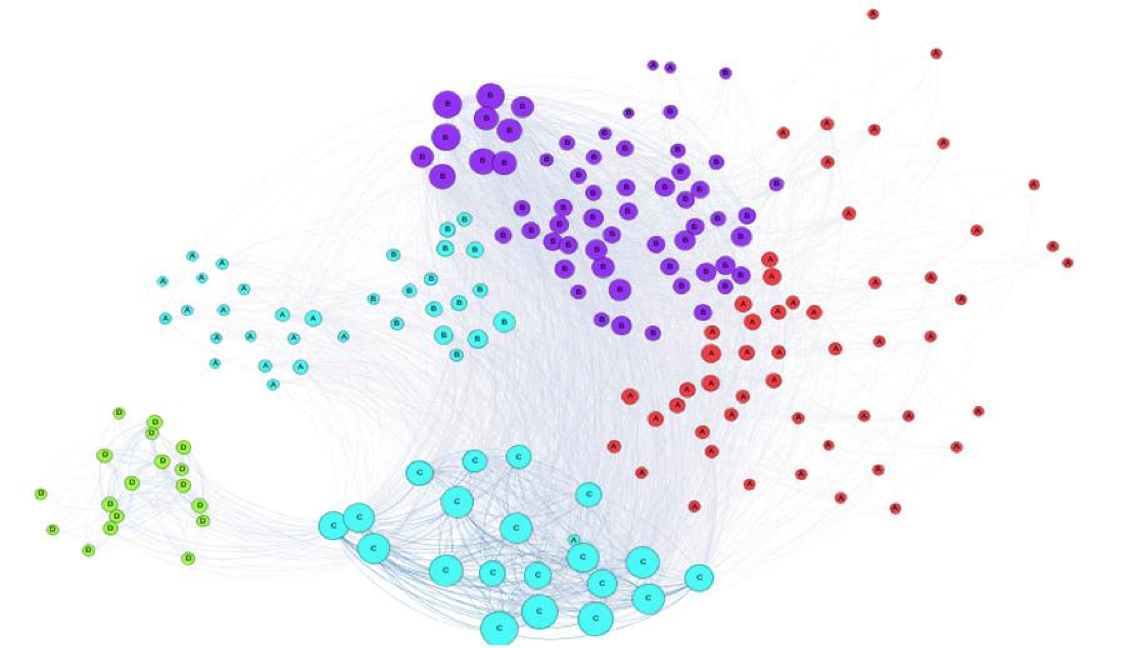
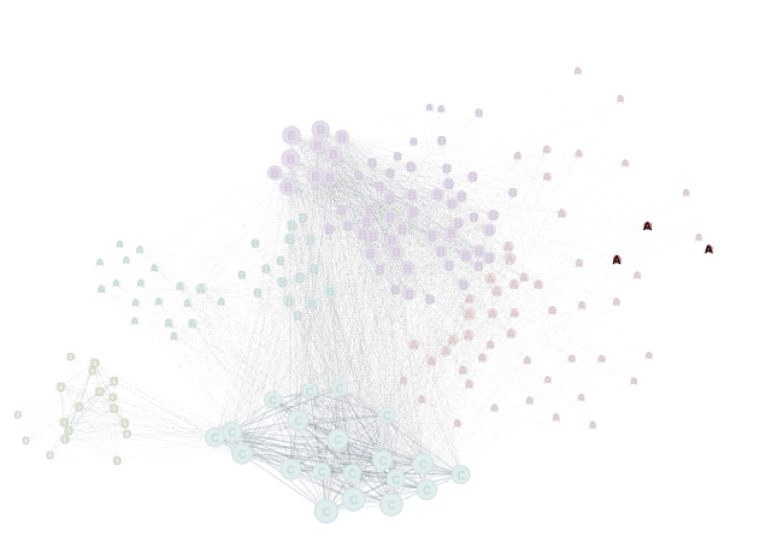
- The node sizes are based on their weighted degree.
- The thickness of the link between the edges are based on the weights between the edges.
- The node color class is based on the modularity class – Gephi was used to detect modularity class to analyze how these matched against the groups ‘seeded’. See Community Detection below
- The Yufan Hu layout was used to create the graph, with some additional manual changes.
COMMUNITY DETECTION
As the users were earlier divided in 4 groups, I tested to see whether the modularity model detected these using a fill histogram.
- From the histogram, we can observe that, Group A is mostly in Modularity Class 2 (Red), but some high affinities with Group C led some of Group A to be associated with the Blue community.
- Group B was largely associated with Modularity Class 3 (Purple) , but some high affinities with Group C led some of Group A to be associated with the Blue community..
- Group C again was entirely associated with Modularity Class 1. . These are identified as the Connoisseurs .
- Group D is clearly a separate community as it only consists of the Modularity Class 0 (Green Community). These were the uses who only watched Mexican movies.
Modularity class did a good job of recognizing the communities
Characteristics of the Graph
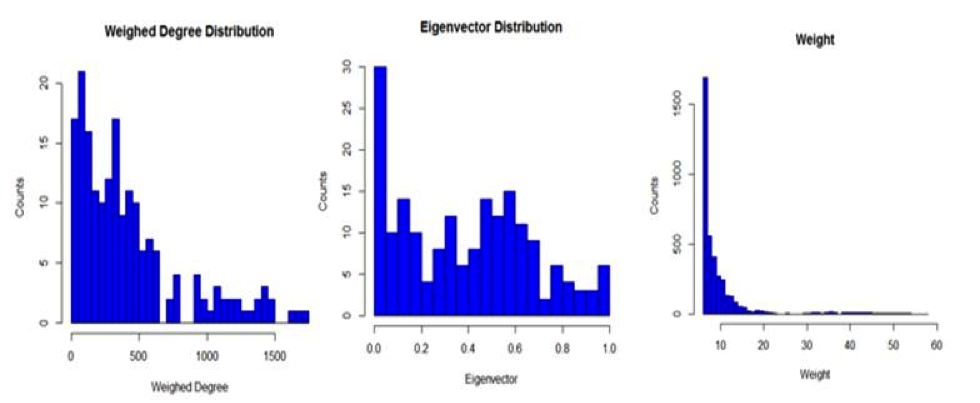
The plots above show the distribution of Weighted Degree and Eigenvector Centrality among the Nodes, and Weight among the Edges.
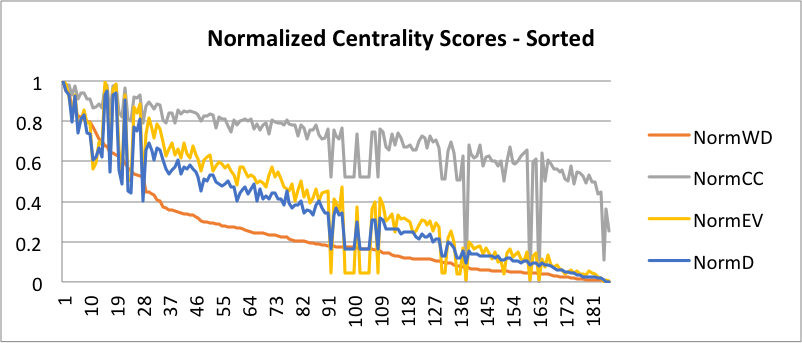
The chart above shows Min-Max normalized centrality measures across the Nodes: the node number represents its Order when sorted by Weighted Degree. We can see in general that nodes with higher Weighted Degrees, also have other high centrality scores
OBJECTIVE: Identify Bellwethers
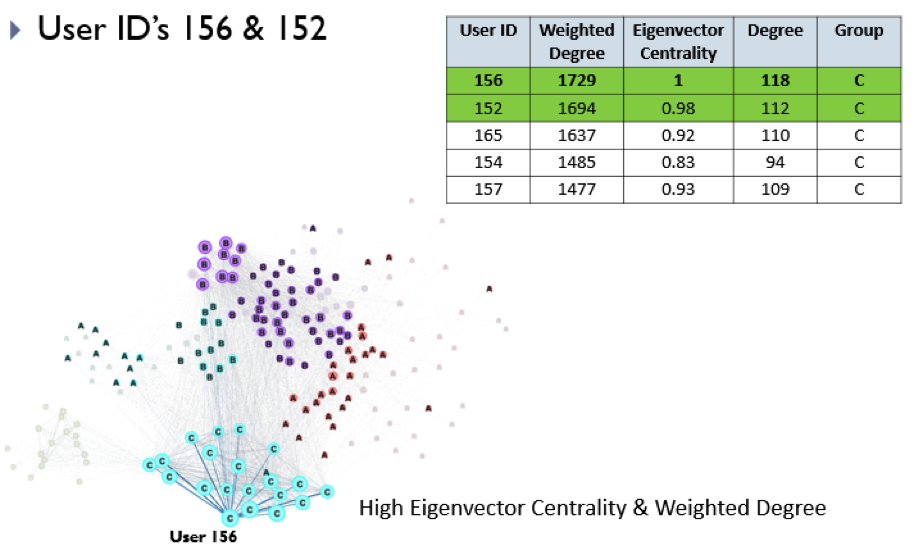
Nodes with high Eigenvector Centrality, Degree and Weighted Degree can be seen as “influential” nodes in a Network. In our case these they represent users whose tastes are highly representative of many others’. Hence we look at these as “Bellwethers” – they can be looked at to predict how many other users may feel about a movie or series pilot. Here we could again at a top 3rd Quartile in terms of Weighted Degree.
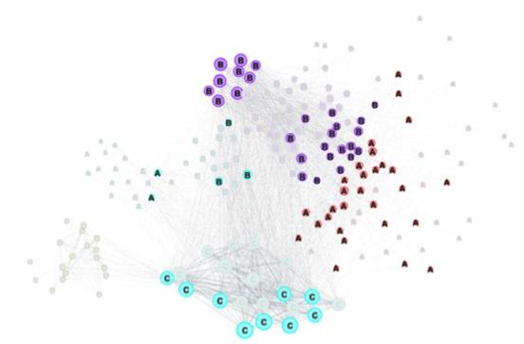
To illustrate, the top 5 are displayed below in the table, and the top node on the graph which highlights that node’s egocentric network. We observe that the top five are all in Group C – the group we seeded as the movie connoisseurs.
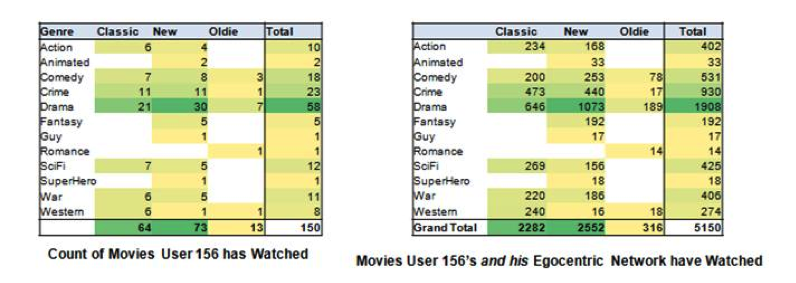
To determine which movies or series to pilot with individual Bellwethers, the movie watching history of that user and their egocentric community can be looked at: high movie counts represent good Genre and Era combinations that are good candidates to preview with them – for example User 156 below, a Bellwether, is a good candidate for preview of Drama, Crime, and Commedy Classic and New movies.
OBJECTIVE: Derive Movie Recommendations
Let us take the example of User 66 – what movies shall we recommend to this user?
- The 1 degree egocentric network is shown in the figure. This user is connected to 69 other users. This network represents users that share similar tastes with the user 66 and have watched similar movies.
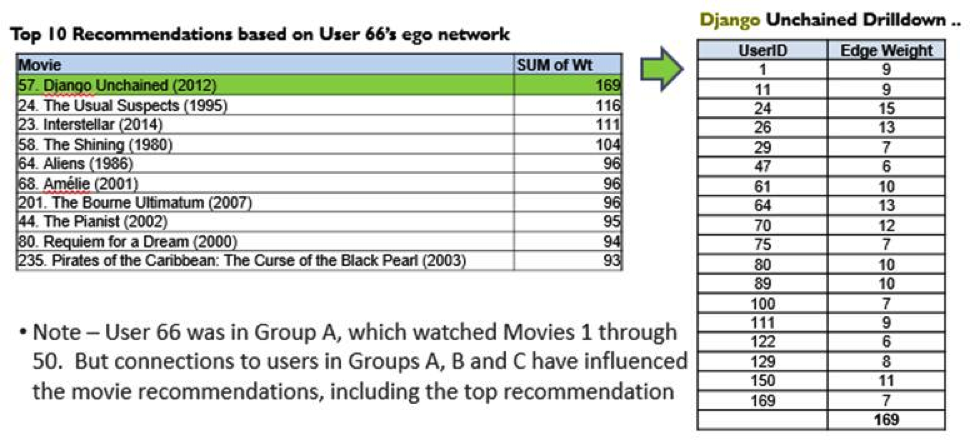
Now studying the movie set this group has watched, we observe that user 66 has not watched 146 movies which the egocentric network has viewed and rated favourably. Using the edge weights, we sort the recommendation list as follows.
Using the sum of weights, we can sort the movie recommendation. The table shown above shows the Top 10 recommendations for the user 66 based on his egocentric network, with a drilldown into how Django Unchained was sorted at the top.
Example 2: Sparse Connections
User 66 has many connections to the other nodes, but let us take the example of a user which is not connected to many users. The reason behind this could be that the has not viewed many movies or has very different tastes than most other users.
User 6 is only connected to 2 other users. Using the technique of the sum of weights from the egocentric network, as described above, we can recommend movies to this user as shown below. However, since this user has such a small network, the number of movies in the recommendation list is low and the weights infer lower confidence levels
From the above table we can see that there are only 6 movies which can be recommended, which are viewed by only 1 user each and the weights are also not significant.
In such scenarios we would use a Jaccard Index to expand the movie recommendation list for User 6 ..
OBJECTIVE: Derive Movie ‘Off the Beaten Path” Recommendations
Jaccard Index calculations were used to identify additional implied connections among users – in order to expand the movies recommendations list.
The table below shows the list of non-zero calculated Jaccard values for User 6 along with the corresponding nodes.
Using the same concept explained in the prior section, we use these values to derive an ‘implied network’ in order to recommend additional movies to user 6. Instead of using weighted degree, we base the sum on the Jaccard index calculated.
By doing this, the movie recommendation list was expanded by 42 movies. In order to prioritize the list, we used the sum of the Jaccard Index scores between nodes (similarly to how we used Weighted Degree previously) as shown below:
Which Implied Links Should We Use?
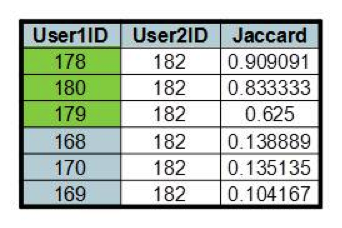
Another example I looked at was user 18 (from Group D – that watched Mexican movies), this one with a set of implied edges with much higher coefficients than the previous example.
The rows highlighted in Green (with the highest Jaccard index values) imply pairings with other Users who are also in the Group D. This makes sense in that they did not watch any of the same movies – and hence did not have any edges in the original graph – but watched only Mexican movies and hence the Jaccard calculation correctly identified implied connections among them. The probelm with including them in the recommendation engine is that the will probably not drive additional variety of movie recommendations.
On the other hand users 170, 169 and 168 have implied linkages with lower coefficients – these are in Group C (Blue Community, The Connoisseurs ) and hence would drive a higher diversity of recommendations. This means that perhaps looking at lower coefficient values is best to find ‘off the beaten path’ movies.
Next Steps and Issues Identified
Tuning
Tune model with additional training data. Tuning possible through optimization of
- Affinity equation
- Graph pruning thresholds
- Weight aggregation model to sort recommended movies
- Jaccard index thresholds
Sparse Data & Watch History
A major assumption in how the data was constructed was that each user logged a rating for every movie watched. In reality most users may not log a rating for most of the movies they watched. Hence constructing a network of users derived from user ratings may result in a very sparse graph.
The way around this would be to also account in the movie affinities among pairs of users, their movie history regardless of whether they rated the movie. This we would call the WatchAffinity. The assumption here is that because users can review and preview movies before they watch a movie on Netflix, the aggregate of their watch history is reflective of their movie tastes.
The edge weight would then be:
Edgeweight= ΣRatingsAffinity + CA ΣWatchAffinity where CA is a weight <1
Other Literature
Performing a search to see whether others have used a similar Graph model approach for the Netflix challenge I came across the following –
- Some blog posts ; but also talk about modeling nodes as Movies, not Viewers
http://www.netflixprize.com/community/viewtopic.php?id=976
http://www.netflixprize.com/community/viewtopic.php?id=365
- Here is a book with references to Netflix and graphs … but could not find reference to how they may drive movie recommendations
- Here is one using a very similar approach to what we did …
http://www.seas.harvard.edu/softmat/downloads/2011-04.pdf
“While we could represent the NetFlix data as a bipartite network [19,22], where the users and movies form sets of disjoint nodes, we instead use the movie ratings (an integer between 1 and 5) to determine a weight between two users, using the simple power law of the form wij = l∈Mij (5 − |∆r (l) ij |) α”

